
I claim that 99% of companies specializing in the development of high-tech products do these three things.
- They have clearly defined metrics that they are trying to move
- They regularly review those metrics
- They try to determine the link between the work they release and how those metrics move.
Also, let's admit that we have never seen a company where 100% of tracking is set up correctly.
Something is always broken, outdated, or missing. Unfortunately, this is the reality of technology products.
If this topic is filled with fear, your tracking infrastructure may be broken somewhere. That's okay; literally everyone is to some extent.
Nevertheless, every subscription company must have a basic hierarchy of metrics, understand what those metrics mean, and strive to improve them.
Why are metrics important
Regardless of the type of product you are building, there are four core things that happen in product development.
- Determining where to focus
- Determining what to ship
- Measuring impact
- Using this to inform what to do next
If you are not measuring the impact of your work, you cannot play in the mall with new ideas or bugs by moving to steps 3 or 4. In the very early stages of startup development, product development is guided by the founder's instincts.
Founders have unique insights about the market and use these insights to guide product development and ship products. They are probably just looking at user sign-ups and revenue, trying to move as quickly as possible.
However, as time goes on and the company grows, founders need to spend more focus on building the company, and the market evolves. This instinctive development style stops being effective.
At this point, companies need to switch to a more structured approach. There, product teams are tasked with setting target metrics and shipping projects to move those targets.
Without a clear hierarchy of metrics to manage the product, it's too easy to change goals quarterly or set goals that the team cannot achieve for the company.
The biggest danger I see in increasing my $1 million is that Arr Companies $5 million will work. They may accidentally break it and not realize it for months.
The best-case scenario is that they understand it and lose months of growth. The worst-case scenario is that it kills them.
Which subscription products should be measured
This is the basic hierarchy of metrics available for most subscription products, divided into three core categories.
- How well the product attracts new users
- How long they stay with the product
- How they leave the product
Note that, because they heavily depend on the product you've built, focus lightly on core product metrics (activation, retention, etc.).
Instead, focus on "business" metrics and the revenue generated by the product.
I'm going to split each group:
- Key Metrics - These are top-level metrics that are likely reported to the company or board. These include "revenue" and "new user sign-ups," for example.
- Secondary metrics, also known as "operational metrics," are metrics that ladder up to drive the key metrics. So, if you're trying to improve new user sign-ups, you might be working on homepage conversion rates.
1. How well the product attracts new users
This bucket is about effectively attracting new users to the product and getting them in the door.
Key Metrics:
- Volume of new sign-ups - for example, the number of people paying you for the first time on a given day/week/month, etc.
- Revenue from new sign-ups - how much money you made from these sign-ups on that day/week/month.
- Conversion rate to paid - how effectively does the free convert to paying customers?
- If this is a direct purchase product, this increases the conversion rate of people landing on the site to pay.
- If there is a free product, this is the conversion rate between the free and paid products.
- If there are trials - this is the end-to-end conversion rate, meaning both who see the trial and who convert from the trial.
Secondary/Operational Metrics:
These will vary by product, but here are some generally useful ones.
- Trial start rate - the number of people who start the trial after seeing it divided by the number of registered users. It's useful to reduce this metric over time windows, so how many people do it within 7, 14, 30, or 60 days of seeing the product?
- Trial conversion rate - the conversion rate to payment within the trial experience. Also reduce this in the same time window as the trial start rate.
- Checkout page conversion rate - of all the people landing on the checkout page, how many are paying you? This data needs to be segmented by device size, country, and payment method.
- Payment button conversion rate - for all users who click "pay" on the checkout page, how many of these users actually successfully pay? You need the best conversion rate here. Segment this by payment method (credit card, PayPal, etc.).
- Plan mix - if there are monthly plans and annual plans, which do users choose? Monitor this monthly and aim to increase the number of people on long-term plans.
2. How long users stay with the product
This bucket is about how well the product retains users. Since you are a subscription product, you'll want to always be increasing these numbers.
As mentioned in other articles, many products have a natural "cap" on retention based on the problems they solve for users. However, you need to understand that limit and work to retain users up to that point.
Key Metrics:
- Lifetime value - as mentioned in other posts, this is a very important metric. However, it's a very difficult metric to use operationally. To move this number, you'll need to define operational metrics.
- Usage period retention - how long users are returning to the product to perform core actions measured over a few weeks or months typically?
- Payment period retention - how long users are paying for the product measured over a few weeks, months, or (if you're lucky) years?
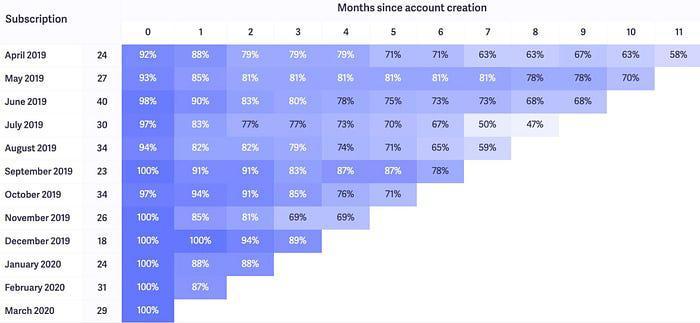
Ideally, you're looking at this data at the cohort level. So, you'll want to see how many months new paid users are staying each month.
Usage is likely to drive payment retention, so when someone stops using something, they'll eventually stop paying.
It's your job to find ways to maintain product usage.
You need to look at retention in both table and chart formats. They'll look something like this.

Operational Metrics
- Payment retention - this is straightforward: what percentage of people who should be paying you are paying you?
- Usage retention - this is much more complex. Let's dive into it.
Most of these metrics are managed by the core product solving problems. This is a framework I learned in Regorge's "Engagement and Retention" course, and it's great.
I can't go into the depth this course can, but at a high level, it's trying to measure the path users must "retain" to keep coming back to the product. That is, they keep coming back to the product.
This path looks like this:
- Sign-up: User joins the product
- Setup Moment: User is ready to experience the core value prop
- Aha Moment: User has experienced the core value prop for the first time
- Habit Moment: User has established a habit around the core value prop
- Retained Moment: User has definitively come back to the product
Improving engagement and retention is central to the product team's work and is essentially an endless process.
3. How they leave the product
Users leave the product in several ways, and it's important to measure cancellations based on these groups.
Before getting into metrics, there are two ways users leave the product.
- Fortunately, I've purchased your product to solve a problem. That problem is now solved, and I no longer need it.
- Unfortunately - this product did not solve my problem, and I'm leaving.
In the example of language learning, if I had paid for a product like Babbel to learn Spanish, I might also
- I have learned enough Spanish. I'm happy and no longer need it.
- I did not learn Spanish and I'm giving up.
Within the "unfortunate" bucket, I've further divided this into two additional buckets.
- Intentional cancellation - entered settings and canceled the account.
- Unintentional cancellation - an issue arose with payment, technology, or another blocker that prevented the use of the service.
Key Metrics
- Monthly 1-month churn rate - how many of the users you had last month canceled? When most people talk about "churn," this is what they're talking about, and you can benchmark against it.
- Time-boxed churn rate - how many of the users who signed up in X period are left after Y months? Typically, this is 3, 6, or 12 months.
Operational Metrics
- Payment failure rate - what percentage of users with recurring transactions failed on the first payment attempt and reached the retry process?
- Payment failure recovery rate - how many of the users who failed the first payment attempt can you recover through revenue recovery strategies?
- Dismissal and resolution rate - how many users who enter the cancellation flow do not take the offer presented?
- "Happy" cancellation rate - how many users is this product working for, and they no longer need it? Note that you need to add this option to the cancellation flow.
So, what do you do with this information?
There's a lot in this post, so don't get overwhelmed. Try not to implement everything at once.
1. Define the true core sources
When metrics are always broken, they help anchor you to the true source for what you care most about. These will be critical lifecycle events captured by other systems.
For the average subscription company, these are:
- Pageviews: for core pages of the site like home, onboarding, checkout, etc.
- Sign-ups: free sign-ups (if they exist), the true best source is usually email data
- Payments: typically payment systems like Stripe/Recurly/Braintree/Paddle
- Cancellations: either within the app itself or a subscription manager
This is especially useful when tracking data is broken or suspect. By looking at email sign-ups/new payments, you can quickly hand off numbers like free to paid conversion rates.
2. Validate primary metric data
Select the key metrics to track and ensure that what's being fed into the reporting system is almost equal to SOT data.
They won't be exactly equal, but they should be close. So, when you look at free to paid conversion data, it should closely match the calculated conversion rate.
Next, select 1-2 operational metrics and do the same gut check. You'll likely find things that are broken, and now is the time to start prioritizing what to fix.
3. Create a basic dashboard and monitor daily
Most of these numbers won't move daily, but watching how they trend and relate to projects can draw out relationships.
You can also build intuition for business seasonality.
End
Usually, companies not monitoring metrics are driven by one or more of these reasons
- No tracking setup.
- No self-service analytics tools
- Your team lacks the skills to see numbers
Identify which of these is your core issue and work from there.